We use some essential cookies to make our website work.

We use optional cookies, as detailed in our cookie policy, to remember your settings and understand how you use our website.

User avatar
HermannSW
Posts: 6575
Joined: Fri Jul 22, 2016 9:09 pm
Location: Eberbach, Germany

Re: JavaScript graph library, for embedding and drawing planar graphs in 2D and/or sphere surface

Sat Jul 09, 2022 1:25 am

I created system of linear equations and did setup for solving just one side of the cycle.
I did that by fixating all non-visited vertices to a position outside of that side (on the opposite side, hidden by white sphere).
First I tried with coordinates in 0°..270° range, result looked interesting, but not crossing free.
So I thought that I might have chosen the wrong side, and that was right.
Forcing to the other side is simply done by adding of 360° (2π) to all phi angles with coordinates <=90°.

Code: Select all

forall_vertices(G, function(v) {
    if (coords[v][0] < Math.PI) {
        coords[v][0] = coords[v][0] + 2 * Math.PI;
    }
});
Now solving system of linear equations with range 180°..450° produced crossing free unit sphere embedding for the first time !
Until now it was OK that OpenSCAD "edge" implementation is a (straight) cylinder, perhaps a bended cyclinder along unit sphere would be better.
Here is embedding of one side of tetrahedron shortest paths cycle, from two viewpoints:
(not drawing the computed vertex positions vertex ball is intenionally for now, to clearly see the cycle vertices)
C40.half.sphere_embedded.png
C40.half.sphere_embedded.png (34.46 KiB) Viewed 9937 times

This code moves all vertices that have not been visited to the other side:

Code: Select all

forall_vertices(G, function(v) {
    if (!visited[v]) {
        coords[v][0] = 0.75 * Math.PI;
        coords[v][1] = Math.PI / 2;
        M.push(v);
    }
});

Currently only edges between visited vertices are drawn for seeing one cycle side only:

Code: Select all

    forall_edges(G, function(e) {
        if (visited[source(G, e)] && visited[target(G, e)]) {
            wlog("edge(", scale_3D(map_3D(coords[source(G, e)][0], coords[source(G, e)][1]), sc), ",", scale_3D(map_3D(coords[target(G, e)][0], coords[target(G, e)][1]), sc), ");");
        }
    });

P.S:
Modified "tutte.js" allows to compute coordinates for planar convex face straight line drawing, as well as now unit sphere embedding.
Mode decision done by checking type of "factor" parameter:
https://github.com/Hermann-SW/planar_gr ... n/tutte.js
https://github.com/Hermann-SW/RSA_numbers_factored
https://stamm-wilbrandt.de/GS [304+402+536fps]
https://hermann-sw.github.io/planar_graph_playground
https://github.com/Hermann-SW/Raspberry_v1_camera_global_external_shutter
https://stamm-wilbrandt.de

User avatar
HermannSW
Posts: 6575
Joined: Fri Jul 22, 2016 9:09 pm
Location: Eberbach, Germany

Re: JavaScript graph library, for embedding and drawing planar graphs in 2D and/or sphere surface

Sat Jul 09, 2022 7:59 pm

It is essential to have round edges, along the sphere surface, to avoid straight line edges through trhe white inner sphere.

New OpenSCAD module "edge2()" works correctly for many edges (eg. left), and wrong for others (right).
p and q are spherical coordinates of the vertices to connect, but in degrees for OpenSCAD; —"sc" is sqrt(n_vertices(G)).
v and w are cartesian 3-dimensional coordinates for "edge()":

Code: Select all

    wlog("module edge(v,w) {");
    wlog("    w = w - v;");
    wlog("    translate(v)");
    wlog("    rotate([0, acos(w[2]/norm(w)), atan2(w[1], w[0])])");
    wlog("    cylinder(norm(w),0.1,0.1);");
    wlog("}");
    wlog("module edge2(p,q,sc) {");
    wlog("    d = q - p;");
    wlog("    translate([0, 0, 0]) rotate([-atan2(d[1], d[0]), p[1]-90, p[0]])");
    wlog("        rotate_extrude(angle=sqrt(d[0]*d[0]+d[1]*d[1]), convexity=10, $fn=100)");
    wlog("            translate([sc, 0]) circle(0.1, $fn=25);");
    wlog("}");
edge2.good_bad.png
edge2.good_bad.png
edge2.good_bad.png (81.49 KiB) Viewed 9846 times

I started with rotate_extrude example, scaled to correct dimensions and then started the rotation angle endeavor to get round edge correctly. For testing I can pass an edge number as last argument, then for this edge the straight as well as round edge are drawn in blue for visual debugging:
https://en.m.wikibooks.org/wiki/OpenSCA ... _Extrusion
rotate_extrude.png
rotate_extrude.png
rotate_extrude.png (176.21 KiB) Viewed 9846 times
https://github.com/Hermann-SW/RSA_numbers_factored
https://stamm-wilbrandt.de/GS [304+402+536fps]
https://hermann-sw.github.io/planar_graph_playground
https://github.com/Hermann-SW/Raspberry_v1_camera_global_external_shutter
https://stamm-wilbrandt.de

User avatar
HermannSW
Posts: 6575
Joined: Fri Jul 22, 2016 9:09 pm
Location: Eberbach, Germany

Re: JavaScript graph library, for embedding and drawing planar graphs in 2D and/or sphere surface

Sun Jul 10, 2022 7:31 am

In case somebody wants to look into this round edge issue, code is not good enough to commit+push yet.
New tuttte.js has been committed and pushed before, current "node.tetra.js" dump at bottom of this posting.

Call for edge 19 to be blue:

Code: Select all

pi@pi400-64:~/planar_graph_playground $ ./rjs node.tetra.js graphs/C20.a white 19
12 pentagons for graph
0 non-pentagons for graph
vertices: 0,3,12,18
max: 18
dists: 3 3 3 3 3 3
edges: 2,3,6,1,20,22,8,27,28,13,14,16
vertices: 0,3,12,18,1,2,16,17,7,6,11,10,4,5,13,14
M.length: 16
pi@pi400-64:~/planar_graph_playground $ 
Results in this display in OpenSCAD with file "x.scad" opened:
(gets updated on each execution of "node.tetra.js")
C20.sele_19.png
C20.sele_19.png
C20.sele_19.png (28.13 KiB) Viewed 9792 times

Function "srad2deg()" converts the JavaScript spherical [phi,theta] coordinate in radians to degree for OpenSCAD:

Code: Select all

function rad2deg(r) {
    return r / Math.PI * 180;
}

function srad2deg(p) {
    return [rad2deg(p[0]), rad2deg(p[1])];
}

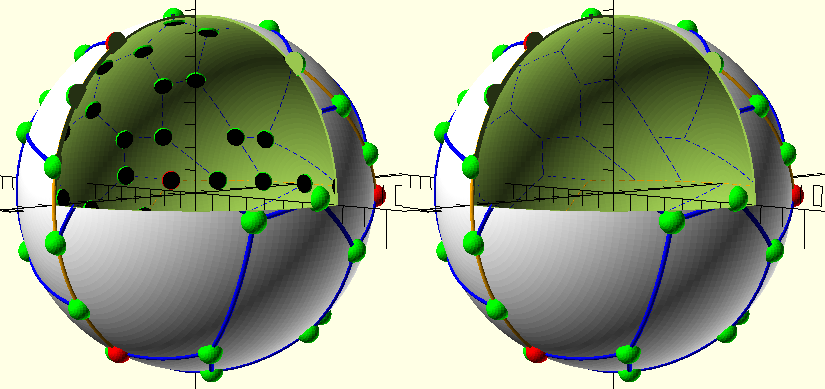
This is central edge drawing function, painting "edge()" and "edge2()" as blue ("sele" is number of edge to draw blue):

Code: Select all

    forall_edges(G, function(e) {
        if (visited[source(G, e)] && visited[target(G, e)]) {
            if (e===sele) { wlog("color([0,0,1])"); } else { wlog("color([0,1,0])"); }
            wlog("edge(", scale_3D(map_3D(coords[source(G, e)][0], coords[source(G, e)][1]), sc), ",", scale_3D(map_3D(coords[target(G, e)][0], coords[target(G, e)][1]), sc), ");");

            if (e===sele) {
                wlog("color([0,0,1])");
                wlog("edge2(", srad2deg(coords[source(G, e)]), ",", srad2deg(coords[target(G, e)]), ",", sc, ");");
            }
        }
    });


Here dump of "node.tetra.js" as is — any help in diagnosing how "edge2()" needs to be modified to be correct is appreciated:
(sync "https://github.com/Hermann-SW/planar_graph_playground" repo, store below as "node.tetra.js", install "nodejs" and "openscad")

Code: Select all

// Copyright: https://mit-license.org/

#include "assert.js"
#include "util.js"
#include "gauss-jordan.js"
#include "tutte.js"
#include "undirected_graph.js"

var coords;
var coords2;

var fs = require("fs");

var writer;
var white = (process.argv.length > 3);
var sele = (process.argv.length > 4) ? parseInt(process.argv[4]) : 0;

var V = 0;
var i;

function out(x) {
    return (typeof(x) === 'object') ? JSON.stringify(x) : x;
}

function wlog(...s) {
    writer.write(out(s[0]));
    for(var i=1; i<s.length; ++i) {
        writer.write(" " + out(s[i]));
    }
    writer.write("\n");
}

function rad2deg(r) {
    return r / Math.PI * 180;
}

function srad2deg(p) {
    return [rad2deg(p[0]), rad2deg(p[1])];
}

function scale_3D(v, f) {
    return [f * v[0], f * v[1], f * v[2]];
}

function map_3D(p, t) {
    return [Math.cos(p) * Math.sin(t), Math.sin(p) * Math.sin(t), Math.cos(t)];
}

function tetra(G, M, sc = 1, edges, visited) {
    var vec = [0,0,1];

    wlog("$vpr = [",-rad2deg(Math.acos(vec[2])),",0,",
                    -rad2deg(Math.atan2(vec[0], vec[1])),"];");
    wlog("$fn = 25;");
    wlog("$vpt = [0,0,0];");
    wlog("module edge(v,w) {");
    wlog("    w = w - v;");
    wlog("    translate(v)");
    wlog("    rotate([0, acos(w[2]/norm(w)), atan2(w[1], w[0])])");
    wlog("    cylinder(norm(w),0.1,0.1);");
    wlog("}");
    wlog("module edge2(p,q,sc) {");
    wlog("    d = q - p;");
    wlog("    translate([0, 0, 0]) rotate([-atan2(d[1], d[0]), p[1]-90, p[0]])");
    wlog("        rotate_extrude(angle=sqrt(d[0]*d[0]+d[1]*d[1]), convexity=10, $fn=100)");
    wlog("            translate([sc, 0]) circle(0.1, $fn=25);");
    wlog("}");
    wlog("module vertex(v, c) { color(c) translate(v) sphere(0.5); }");

    forall_edges(G, function(e) {
        if (visited[source(G, e)] && visited[target(G, e)]) {
            if (e===sele) { wlog("color([0,0,1])"); } else { wlog("color([0,1,0])"); }
            wlog("edge(", scale_3D(map_3D(coords[source(G, e)][0], coords[source(G, e)][1]), sc), ",", scale_3D(map_3D(coords[target(G, e)][0], coords[target(G, e)][1]), sc), ");");

            if (e===sele) {
                wlog("color([0,0,1])");
                wlog("edge2(", srad2deg(coords[source(G, e)]), ",", srad2deg(coords[target(G, e)]), ",", sc, ");");
            }
        }
    });
/*
    forall_edges(G, function (e) {
//        wlog("edge(", scale_3D(coords[source(G, e)], sc), ",", scale_3D(coords[target(G, e)], sc), ");");
        wlog("edge2(", srad2deg(coords[source(G, e)]), ",", srad2deg(coords[target(G, e)]), ",", sc, ");");
    });

    forall_vertices(G, function (v) {
        wlog("vertex(", scale_3D(coords[v][0], coords[v][1], sc), ",", (v==V) ? [1,0,0] : [0,1,0], ");");
    });
*/
    console.log("M.length:", M.length);

    M.forEach(function(v) {
        wlog( "vertex(", scale_3D(map_3D(coords[v][0], coords[v][1]), sc), ",", (v===V) ? [1,0,0] : [0,1,0], ");");
    });

    if (white) {
        wlog("color([1,1,1]) translate([0,0,0]) sphere(", 0.8*sc, ");");
    }
/*
    var a = M[0]; //opposite(G, M[0], next[M[0]][M[2]]);
    var b = opposite(G, a, next[a][M[2]]);
    wlog( "vertex(", scale_3D(map_3D(coords[a][0], coords[a][1]), sc), ",", [0,0,1] , ");");
    wlog( "vertex(", scale_3D(map_3D(coords[b][0], coords[b][1]), sc), ",", [0,0,1] , ");");
    wlog("edge2(", srad2deg(coords[a]), ",", srad2deg(coords[b]), ",", sc, ");");
*/
}

function ok(a,b,c,d,e,f) {
    var m = Math.max(a, b, c, d, e, f);
    return (((m - a) <= 1) && ((m - b) <= 1) && ((m - c) <= 1) &&
            ((m - d) <= 1) && ((m - e) <= 1) && ((m - f) <= 1));
}

assert.assert(process.argv.length > 2);

var adj = parse2file(process.argv[2]);

var G = from_adjacency_list(adj);

assert.assert(is_embedding(G));

var pent = pentagons(G);
console.log(pent.length + " pentagons for graph");
console.log(n_faces_planar(G) - pent.length + " non-pentagons for graph");

var dist;
var next;
[dist, next] = floyd_warshall_path(G);

var max = 0;
var M = [0,0,0,0];
var i;
var j;

forall_vertices(G, function(a) {
    forall_vertices_after(G, a, function(b) {
        forall_vertices_after(G, b, function(c) {
            forall_vertices_after(G, c, function(d) {
                if (dist[a][b] + dist[a][c] + dist[a][d] +
                    dist[b][c] + dist[b][d] + dist[c][d] > max) {
                    if (ok(dist[a][b], dist[a][c], dist[a][d],
                           dist[b][c], dist[b][d], dist[c][d])) {

                        max = dist[a][b] + dist[a][c] + dist[a][d] +
                              dist[b][c] + dist[b][d] + dist[c][d];
                        M = [a, b, c, d];
                    }
                }
            });
        });
    });
});

console.log("vertices:", String(M));
console.log("max:", max);
console.log("dists:", dist[M[0]][M[1]], dist[M[0]][M[2]], dist[M[0]][M[3]],
                      dist[M[1]][M[2]], dist[M[1]][M[3]], dist[M[2]][M[3]]);
var edges = [].concat(fw_path(G, next, M[0], M[1]),
                      fw_path(G, next, M[0], M[2]),
//                      fw_path(G, next, M[0], M[3]),
//                      fw_path(G, next, M[1], M[2]),
                      fw_path(G, next, M[1], M[3]),
                      fw_path(G, next, M[2], M[3]));
console.log("edges:", String(edges));

for(i=0; i<4; i=i+1) {
    for(j=i+1; j<4; j=j+1) {
        if (new Set(fw_path(G, next, M[i], M[j]).concat(fw_path(G, next, M[j], M[i]))).size !== dist[M[i]][M[j]]) {
            console.log("edges2:", fw_path(G, next, M[i], M[j]), fw_path(G, next, M[j], M[i]));
            process.exit(1);
        }
    }
}

function mark(G, visited, v, w) {
    var e;
    var o;
    var dp = (coords[w][0] - coords[v][0]) / (dist[v][w]);
    var dt = (coords[w][1] - coords[v][1]) / (dist[v][w]);
    e = next[v][w];
    while (v != w) {
        o = v;
        v = opposite(G, v, e);
        e = next[v][w];
        assert.assert(!visited[v]);
        visited[v] = true;
        if (v != w) {
            coords[v][0] = coords[o][0]+dp;
            coords[v][1] = coords[o][1]+dt;
            M.push(v);
        }
    }
}

function mark2(G, visited, v, w) {
    var e;
    var dir = v < w;
    var o;
    var dp = 0;
    var dt = -2 * coords[w][1] / (dist[v][w]);
    if (coords[w][1] > Math.PI/2) {
        dt = 2 * (Math.PI - coords[w][1]) / dist[v][w];
    }
    e = next[v][w];
    while (v != w) {
        o = v;
        v = opposite(G, v, e);
        e = next[v][w];
        if (v != w) {
            coords[v][0] = coords[o][0];
            coords[v][1] = coords[o][1] + dt;
            if (coords[v][1] < 0 || coords[v][1] > Math.PI) {
                break;
            }
            if (dir && (coords[v][1] === 0 || coords[v][1] === Math.PI)) {
                break;
            }
            M.push(v);
            assert.assert(!visited[v]);
            visited[v] = true;
        }
    }
}

function srch(G, visited, v) {
    if (!visited[v]) {
        visited[v] = true;
        forall_incident_edges(G, v, function(e) {
            srch(G, visited, opposite(G, v, e));
        });
    }
}

coords = filled_array(n_vertices(G), 2, -1);
coords[M[0]] = [3*Math.PI/2, Math.acos(+Math.sqrt(1/3))];
coords[M[1]] = [  Math.PI/2, Math.acos(+Math.sqrt(1/3))];
coords[M[2]] = [    Math.PI, Math.acos(-Math.sqrt(1/3))];
coords[M[3]] = [          0, Math.acos(-Math.sqrt(1/3))];

var visited = filled_array(n_vertices(G), 1, false);

mark2(G, visited, M[0], M[1]);
 mark2(G, visited, M[1], M[0]);
 mark(G, visited, M[1], M[3]);
 mark2(G, visited, M[3], M[2]);
mark2(G, visited, M[2], M[3]);
mark(G, visited, M[2], M[0]);
visited[M[1]]=true;
visited[M[2]]=true;

var e;
e = next_incident_edge(G, M[0], next[M[0]][M[1]]);
if (e == next[M[0]][M[2]]) {
    e = next_incident_edge(G, M[0], e);
}
srch(G, visited, opposite(G, M[0], e));

forall_vertices(G, function(v) {
    if (!visited[v]) {
        coords[v][0] = 0.75 * Math.PI;
        coords[v][1] = Math.PI / 2;
        M.push(v);
/*
        while (degree(G, v) > 0) {
            var e = first_incident_edge(G, v);
            remove_edge1(G, opposite(G, v, e), e);
            remove_edge1(G, v, e);
        }
*/
    }
});

console.log("vertices:", String(M));

if (true) {
forall_vertices(G, function(v) {
    if (coords[v][0] < Math.PI) {
        coords[v][0] = coords[v][0] + 2 * Math.PI;
    }
});
}

coords2 = tutte.convex_face_coordinates(G, M, coords);

forall_vertices(G, function(v) {
    coords[v][0] = coords2[0][v];
    coords[v][1] = coords2[1][v];
});

V = M[0];

writer = fs.createWriteStream('x.scad')

tetra(G, M, Math.sqrt(n_vertices(G)), edges, visited);

writer.close();

https://github.com/Hermann-SW/RSA_numbers_factored
https://stamm-wilbrandt.de/GS [304+402+536fps]
https://hermann-sw.github.io/planar_graph_playground
https://github.com/Hermann-SW/Raspberry_v1_camera_global_external_shutter
https://stamm-wilbrandt.de

User avatar
HermannSW
Posts: 6575
Joined: Fri Jul 22, 2016 9:09 pm
Location: Eberbach, Germany

Re: JavaScript graph library, for embedding and drawing planar graphs in 2D and/or sphere surface

Mon Jul 11, 2022 7:04 pm

TIL:
Drawing round edge on sphere surface is along a great circle.
The length of the edge in radians (on unit sphere) is named great-circle distance.
What is needed to draw the round edge between two points is great-circle navigation.
Spherical geometry is completely different to Euclidean geometry with cartesian coordinates.

I determined all the alphas, sigmas, lambdas, ... and "edge2()" got really big:

Code: Select all

    wlog("module edge2(p1,p2,sc) {");
    wlog("    la1 = p1[0];");
    wlog("    la2 = p2[0];");
    wlog("    l12 = la2 - la1;");
    wlog("    ph1 = 90 - p1[1];");
    wlog("    ph2 = 90 - p2[1];");
    wlog("    al1 = atan2(cos(ph2)*sin(l12), cos(ph1)*sin(ph2)-sin(ph1)*cos(ph2)*cos(l12));");
    wlog("    al0 = atan2(sin(al1)*cos(ph1), sqrt(cos(al1)*cos(al1)+sin(al1)*sin(al1)*sin(ph1)*sin(ph1)));");
    wlog("    s01 = atan2(tan(ph1), cos(al1));");
    wlog("    l01 = atan2(sin(al0)*sin(s01), cos(s01));");
    wlog("    la0 = la1 - l01;");

Code: Select all

    wlog("    s12 = acos(sin(ph1)*sin(ph2)+cos(ph1)*cos(ph2)*cos(l12));");
    wlog("    translate([0, 0, 0]) rotate([0, 0, la0+180]) rotate([al0+90, 0, 0]) rotate([0, 0, s01-90])");
    wlog("        rotate_extrude(angle=s12, convexity=10, $fn=100)");
    wlog("            translate([sc, 0]) circle(0.1, $fn=25);");
    wlog("}");
I don't know why I had to add 180° to 1st rotate, add 90° to 2nd rotate and subtract 90° to 3rd rotate.
But for edge 33 of C40 it draws the round edge (of length sigma_12 or s12) correctly:

Code: Select all

pi@pi400-64:~/planar_graph_playground $ ./rjs node.tetra.js graphs/C40.a white 33
12 pentagons for graph
10 non-pentagons for graph
vertices: 0,4,24,30
max: 28
dists: 4 5 5 5 5 4
edges: 2,3,6,7,0,18,17,24,26,9,30,32,48,49,40,41,52,50
vertices: 0,4,24,30,1,3,2,16,17,28,29,31,32,23,13,12,8,9,5,6,7,14,15,25,26,27,33,34,35,36,37,38,39
M.length: 33
pi@pi400-64:~/planar_graph_playground $ 
C40.sele_33.png
C40.sele_33.png
C40.sele_33.png (27.64 KiB) Viewed 9694 times

But for all other edges that does not work.

"rotate([0, 0, la0])" should move the start of round edge to point A(0, lambda_0) on equator:
Image
"rotate([al0, 0, 0])" should rotate azimuth to alpha0.
Finally "rotate([0, 0, s01])" should move round edge from point A to P1, and end of round edge should be P2.

I will have to select another edge for investigation whether that works, or which other modification is needed for that edge.
At least the Wikipedia pages I pointed to seem to have all the formulas needed for "edge2()".


P.S:
I did set view temporarily to this instead of "[0,0,0]" to have edge 33 always directly in view:

Code: Select all

wlog("$vpr = [90,0,110];");
OpenSCAD displays "rotate = [...]" at bottom, so I rotated target view manually and used the angles reported from then on.


P.P.S:
I made the 3rd rotate a noop by "rotate([0,0,0])".
alpha_0 as well as lambda_0 (of point A) are good, for all edges I tested, here for edge 36:
C40.sele_36.png
C40.sele_36.png
C40.sele_36.png (44.88 KiB) Viewed 9651 times
Seems that sigma_01 (s01) does not get computed correctly ...
https://github.com/Hermann-SW/RSA_numbers_factored
https://stamm-wilbrandt.de/GS [304+402+536fps]
https://hermann-sw.github.io/planar_graph_playground
https://github.com/Hermann-SW/Raspberry_v1_camera_global_external_shutter
https://stamm-wilbrandt.de

User avatar
HermannSW
Posts: 6575
Joined: Fri Jul 22, 2016 9:09 pm
Location: Eberbach, Germany

Re: JavaScript graph library, for embedding and drawing planar graphs in 2D and/or sphere surface

Tue Jul 12, 2022 2:09 am

This simple change makes it nearly look as the formulas in Wikipedia, only "90-al0" instead of just "al0" in 2nd of 3 rotates:

Code: Select all

pi@pi400-64:~/planar_graph_playground $ diff edge2.old edge2.new 
13c13
<     wlog("    translate([0, 0, 0]) rotate([0, 0, la0+180]) rotate([al0+90, 0, 0]) rotate([0, 0, s01-90])");
---
>     wlog("    translate([0, 0, 0]) rotate([0, 0, la0]) rotate([90-al0, 0, 0]) rotate([0, 0, s01])");
pi@pi400-64:~/planar_graph_playground $ 

This litte comment out draws round blue edge for every drawn green straight edge:

Code: Select all

//            if (e===sele) {
                wlog("color([0,0,1])");
                wlog("edge2(", srad2deg(coords[source(G, e)]), ",", srad2deg(coords[target(G, e)]), ",", sc, ");");
//            }

For all edges besides few edges near north or south pole the round edges look good, here for C40 and C20 fullerenes:
C40_C20.blue.png
C40_C20.blue.png
C40_C20.blue.png (56.53 KiB) Viewed 9646 times

Next step is fixing the pole edge issue left, then round edge "edge2()" OpenSCAD module will be complete.


P.S:
The top blue round edge demonstrates why I want spherical distance length round blue edges between two points on unit sphere — the straight line green edge passes through white inner sphere.
What I did not expect is demonstrated by the long bottom right blue edge, the vertex ball diameter is too big, and the long edge passes through several vertices:
C36.4_blue.png
C36.4_blue.png
C36.4_blue.png (14.18 KiB) Viewed 9631 times

P.P.S:
Tutte planar graph spring embedding in the plane (with convex outer face) guarantees a "convex face straight line drawing".
Because the tetrahedron cycle had to be constructed such that not full 360° circle "phi" angles are covered, as shown here one or two (on opposite side) non-convex sphere spring embedder face(s) might exists (here a hexagon, 5 vertices with balls and one computed position vertex without):
C36.4_non-convex_face.png
C36.4_non-convex_face.png (26.66 KiB) Viewed 9628 times
https://github.com/Hermann-SW/RSA_numbers_factored
https://stamm-wilbrandt.de/GS [304+402+536fps]
https://hermann-sw.github.io/planar_graph_playground
https://github.com/Hermann-SW/Raspberry_v1_camera_global_external_shutter
https://stamm-wilbrandt.de

User avatar
HermannSW
Posts: 6575
Joined: Fri Jul 22, 2016 9:09 pm
Location: Eberbach, Germany

Re: JavaScript graph library, for embedding and drawing planar graphs in 2D and/or sphere surface

Tue Jul 12, 2022 3:11 pm

The non-convex face made me rethink the tetrahedron cycle decision.
I will go with the 4 tetrahedron faces instead, because each shortest path triangle is convex, and so will be the whole computed embedding by solving 4 systems of linear equations.

Next, I added annotation to current "edge2()" implementation, with crossreferencing OpenSCAD variable names and Wikipedia formula variables:

Code: Select all

module edge2(p1,p2,sc) {
    // al/la/ph: alpha/lambda/phi | lxy/sxy: delta lambda_xy/sigma_xy
    // https://en.wikipedia.org/wiki/Great-circle_navigation#Course
    la1 = p1[0];
    la2 = p2[0];
    l12 = la2 - la1;
    ph1 = 90 - p1[1];
    ph2 = 90 - p2[1];
    al1 = atan2(cos(ph2)*sin(l12), cos(ph1)*sin(ph2)-sin(ph1)*cos(ph2)*cos(l12));
    al0 = atan2(sin(al1)*cos(ph1), sqrt(cos(al1)*cos(al1)+sin(al1)*sin(al1)*sin(ph1)*sin(ph1)));

Code: Select all

    s01 = atan2(tan(ph1), cos(al1));
    l01 = atan2(sin(al0)*sin(s01), cos(s01));
    la0 = la1 - l01;
    // delta sigma_12
    // https://en.wikipedia.org/wiki/Great-circle_distance#Formulae
    s12 = acos(sin(ph1)*sin(ph2)+cos(ph1)*cos(ph2)*cos(l12));
    translate([0, 0, 0]) rotate([0, 0, la0]) rotate([90-al0, 0, 0]) rotate([0, 0, s01])
        rotate_extrude(angle=s12, convexity=10, $fn=100)
            translate([sc, 0]) circle(0.1, $fn=25);
}


Next my single "srch()" for identifying all vertices on one side of tetrahedron cycle is too simple.
While C36.11 is planar, and an embedding, there is a crossing blue edge from top to bottom.
Reason is that current drawing code is too simplistic.
What is needed is to traverse shortest paths tetrahedron cycle or triangles like traversing a planar embedding face.
And then to call "srch()" for each edge into the cycle/triangle.
And srch needs to be modified to use boolean edge array evisited in addition to boolean vertex array visited.
C36.11_crossing_edge_although_planar.png
C36.11_crossing_edge_although_planar.png (15.32 KiB) Viewed 9596 times
https://github.com/Hermann-SW/RSA_numbers_factored
https://stamm-wilbrandt.de/GS [304+402+536fps]
https://hermann-sw.github.io/planar_graph_playground
https://github.com/Hermann-SW/Raspberry_v1_camera_global_external_shutter
https://stamm-wilbrandt.de

User avatar
HermannSW
Posts: 6575
Joined: Fri Jul 22, 2016 9:09 pm
Location: Eberbach, Germany

Re: JavaScript graph library, for embedding and drawing planar graphs in 2D and/or sphere surface

Wed Jul 20, 2022 6:30 pm

It was a herd fight to get OpenSCAD "edge2()" work in all cases.
I tested with C20/C40/C60 and C36.[4/7/8/11/14].
I found failures of edge2() in many of those graphs.
Edges near north pole, south pole, edges with big s01, edges crossing equator, ...
It turned out that OpenSCAD does not allow to assign to outer scope variables in if/else statements.
I ended with 6 cases and even these 6 case did not fix all edges in the test graphs.
Finally it turned out that it is better to move directly to P1 instead of to P0 on equator first:

Code: Select all

stammw@t480ub:~/planar_graph_playground$ diff old new
17c17,18
<     translate([0, 0, 0]) rotate([0, 0, la0]) rotate([90-al0, 0, 0]) rotate([0, 0, s01])
---
>     translate([0, 0, 0]) rotate([0, 0, la1]) rotate([0, -ph1, 0])
>       rotate([90 - al1, 0, 0])
stammw@t480ub:~/planar_graph_playground$ 
All changes are contained in just pushed commit:
(so you can play with as well, with "x.scad" opened in OpenSCAD)
https://github.com/Hermann-SW/planar_gr ... 15a5d0e3b9

Complete "edge2()" is here:
https://github.com/Hermann-SW/planar_gr ... js#L61-L81
I just deleted lines for now unused variables al0, s01, l01 and la0, and all still works:
https://github.com/Hermann-SW/planar_gr ... js#L70-L73

Running "./rjs node.tetra.js graphs/C60.a white" sphere embeds half of C60 now correctly with round edges:
screenshot.png
screenshot.png
screenshot.png (36.04 KiB) Viewed 9511 times

Time to not draw straight line (green) edges anymore.
I have already implemented computation of all vertices on the 6 tetrahedron shortest paths, but that file is on my Pi400.
Will add working "edge2()" to that tomorrow when back home.
Then with "shortest paths face traversal" technique applied to the 4 tetrahedron triangles, I should get convex graph embedding onto the sphere of planar graphs for the first time.


P.S:
When I will get a nice C60 embedding onto sphere, I will export as STL and 3Dprint with my Prusa MINI+ ... (just the sphere embedding with vertex spheres and rotate_extrude edges, without "white" option)
https://github.com/Hermann-SW/RSA_numbers_factored
https://stamm-wilbrandt.de/GS [304+402+536fps]
https://hermann-sw.github.io/planar_graph_playground
https://github.com/Hermann-SW/Raspberry_v1_camera_global_external_shutter
https://stamm-wilbrandt.de

User avatar
HermannSW
Posts: 6575
Joined: Fri Jul 22, 2016 9:09 pm
Location: Eberbach, Germany

Re: JavaScript graph library, for embedding and drawing planar graphs in 2D and/or sphere surface

Thu Jul 21, 2022 12:14 pm

Now that convex face sphere embedding is nearly done, I asked myself whether in addition to OpenSCAD output 3D output in browser can be done as well.
And the answer seams to be WebGL, here are several demos:
https://www.khronos.org/webgl/wiki/Demo_Repository

I played with shiny-teapot demo, and that provides mouse (or finger on Android) controlled 3D rotation:
https://registry.khronos.org/webgl/sdk/ ... index.html

On Pi400 peek screenrecorded:
Image

I did disable "Use hardware acceleration when available" in Chromium, and still teapot demo works nicely.
So I will have to learn how to use WebGL in addition to OpenSCAD for interactive sphere embedding 3D output in browser.
https://github.com/Hermann-SW/RSA_numbers_factored
https://stamm-wilbrandt.de/GS [304+402+536fps]
https://hermann-sw.github.io/planar_graph_playground
https://github.com/Hermann-SW/Raspberry_v1_camera_global_external_shutter
https://stamm-wilbrandt.de

User avatar
HermannSW
Posts: 6575
Joined: Fri Jul 22, 2016 9:09 pm
Location: Eberbach, Germany

Re: JavaScript graph library, for embedding and drawing planar graphs in 2D and/or sphere surface

Thu Jul 21, 2022 2:40 pm

WebGL has a huge learning curve.

I found THREE.js as alternative, but drawing a simple sphere is complex as well.

At least I found a working 54 line only sphere animation JSFiddle, just in case I will go that route later:
http://jsfiddle.net/BHUPENDRA1011/4ZwYm/
Peek_2022-07-21_16-38.gif
Peek_2022-07-21_16-38.gif (149.41 KiB) Viewed 9426 times

Now back to full planar graph convex face sphere embedding with OpenSCAD ...


P.S:
Adding full tetrahedron code into new "edge2()" based "node.tetra.js" from yesterday was easy.
I commented out drawing of straight green edges.
And I increased white sphere radius from "0.8*sc" to "sc-0.5" with scaling factor "sc" and vertex sphere radius 0.5.
This way the vertex spheres now touch the white sphere, while round edges have a bit distance.
Currently calling "srch()" to visit vertices for computing vertex coordinates is commented out — that is what is next to work on:
only_round_edges.touching.png
only_round_edges.touching.png (18.46 KiB) Viewed 9415 times
https://github.com/Hermann-SW/RSA_numbers_factored
https://stamm-wilbrandt.de/GS [304+402+536fps]
https://hermann-sw.github.io/planar_graph_playground
https://github.com/Hermann-SW/Raspberry_v1_camera_global_external_shutter
https://stamm-wilbrandt.de

User avatar
HermannSW
Posts: 6575
Joined: Fri Jul 22, 2016 9:09 pm
Location: Eberbach, Germany

Re: JavaScript graph library, for embedding and drawing planar graphs in 2D and/or sphere surface

Thu Jul 21, 2022 9:51 pm

I can successfully compute coordinates for vertices in north+west tetraeder triangle (as shown), as well as for south+east.
What currently does not work is doing both calculations after another correctly:
Image
The 4 tetrahedron vertices are colored red.
https://github.com/Hermann-SW/RSA_numbers_factored
https://stamm-wilbrandt.de/GS [304+402+536fps]
https://hermann-sw.github.io/planar_graph_playground
https://github.com/Hermann-SW/Raspberry_v1_camera_global_external_shutter
https://stamm-wilbrandt.de

User avatar
HermannSW
Posts: 6575
Joined: Fri Jul 22, 2016 9:09 pm
Location: Eberbach, Germany

Re: JavaScript graph library, for embedding and drawing planar graphs in 2D and/or sphere surface

Fri Jul 22, 2022 11:52 am

I learned from @caterpillar on twitter yesterday that there are other options for great circle OpenSCAD arcs:
https://twitter.com/caterpillar/status/ ... 8914697216
I like his rotate_extrude based solution from today:
Image


I just adapted the white sphere radius to "sc" instead of "sc-0.5" as @caterpillar did (by adding 0.5), just changing last line in generated x.scad:

Code: Select all

color([1,1,1,0.5]) translate([0,0,0]) sphere( 7.245966692414834+0.5 );

I added 50% transparency as well, which allows to see all edges, while still knowing which are on front half sphere and which are on back.
Vertex spheres as well as great circle arcs are half sunken in white sphere, but that looks OK even without transparency.
Here again two tetrahedron triangles filled with computed position vertices of C60 fullerene, the 4 tetrahedron vertices are the red ones:
C60.half.transp50.png
C60.half.transp50.png (69.16 KiB) Viewed 9287 times
https://github.com/Hermann-SW/RSA_numbers_factored
https://stamm-wilbrandt.de/GS [304+402+536fps]
https://hermann-sw.github.io/planar_graph_playground
https://github.com/Hermann-SW/Raspberry_v1_camera_global_external_shutter
https://stamm-wilbrandt.de

User avatar
HermannSW
Posts: 6575
Joined: Fri Jul 22, 2016 9:09 pm
Location: Eberbach, Germany

Re: JavaScript graph library, for embedding and drawing planar graphs in 2D and/or sphere surface

Sat Jul 23, 2022 5:32 pm

One step back to non-tetrahedron version, adding debuggability features!
I learned that right clicking a (straight or rounded) edge or a vertex sphere shows a stack trace window in OpenSCAD.
Clicking on any line in stack trace highlights the corresponding line in OpenSCAD source code.
Until today that showed spherical parameters passed, not helpful in debugging graph vertices and edges.

With latest commit pushed now useful debug information becomes available:
https://github.com/Hermann-SW/planar_gr ... acac5dd5f8

The trick was to move functions "map_3D()" and "scale_3D()" form NodeJS into OpenSCAD.
So what does this allow for?

Here the three new debug options, first for right clicking on a vertex.
Clicking on "vertex()" line in stack trace highlights the corresponding line in OpenSCAD source code:
OpenSCAD.debug.vertex.png
OpenSCAD.debug.vertex.png (46.72 KiB) Viewed 9211 times
As you can see in copied in left bottom line 319, the stack trace left top vertex is vertex "1".

This shows right clicking on a (not used later) straight line edge.
Clicking on "edge()" line in stack trace highlights the corresponding line in OpenSCAD source code:
OpenSCAD.debug.edge.png
OpenSCAD.debug.edge.png (45.66 KiB) Viewed 9211 times
As you can see in copied in left bottom line 120, the stack trace left top edge is edge between vertex "1" and "39".

Last right clicking on a great circle arc edge.
Clicking on "edge2()" line in stack trace highlights the corresponding line in OpenSCAD source code:
OpenSCAD.debug.edge2.png
OpenSCAD.debug.edge2.png (50.5 KiB) Viewed 9211 times
As you can see in copied in left bottom line 122, the stack trace left top edge2 is between vertex "1" and "39" as well.
https://github.com/Hermann-SW/RSA_numbers_factored
https://stamm-wilbrandt.de/GS [304+402+536fps]
https://hermann-sw.github.io/planar_graph_playground
https://github.com/Hermann-SW/Raspberry_v1_camera_global_external_shutter
https://stamm-wilbrandt.de

User avatar
HermannSW
Posts: 6575
Joined: Fri Jul 22, 2016 9:09 pm
Location: Eberbach, Germany

Re: JavaScript graph library, for embedding and drawing planar graphs in 2D and/or sphere surface

Sun Jul 24, 2022 2:38 am

Just learned how to use OpenSCAD "text()" module, how to make text flat, rotate and move into position and align:
https://en.wikibooks.org/wiki/OpenSCAD_User_Manual/Text

With latest commit I added "vtxt()" module, that places vertex number in front of vertex sphere:
https://github.com/Hermann-SW/planar_gr ... da6721e424
A bit tricky, but with the pieces I already had from "vertex()" module not that difficult:
OpenSCAD.vtxt.png
OpenSCAD.vtxt.png
OpenSCAD.vtxt.png (53.13 KiB) Viewed 9149 times

I appended these lines manually and pressed F5 to preview:

Code: Select all

vtxt(39);
vtxt(52);
vtxt(53);
Rotation demonstrates the result:
Image
https://github.com/Hermann-SW/RSA_numbers_factored
https://stamm-wilbrandt.de/GS [304+402+536fps]
https://hermann-sw.github.io/planar_graph_playground
https://github.com/Hermann-SW/Raspberry_v1_camera_global_external_shutter
https://stamm-wilbrandt.de

User avatar
HermannSW
Posts: 6575
Joined: Fri Jul 22, 2016 9:09 pm
Location: Eberbach, Germany

Re: JavaScript graph library, for embedding and drawing planar graphs in 2D and/or sphere surface

Mon Jul 25, 2022 3:50 pm

Another slight sidetrack.
For planar convex face straight line drawings the 12 pentagon faces got colored grey.
I wanted to have the same for the sphere pentagon faces.

What is needed here are spherical polygons, and they are most easily built from spherical traiangle.
https://en.wikipedia.org/wiki/Spherical_trigonometry

Yesterday I was able to create OpenSCAD module that draws a spherical triangle with two same length sides:
gc_triangle.1.scad.png
gc_triangle.1.scad.png (55.45 KiB) Viewed 9036 times

Today I made use of that to create "module sp_tria(_p1, _p2, _p3)" that draws triangle for the three vertices _p1, _p2 and _p3.
It does some graph computations, and then call modified module from yesterday, with radius, theta and phi angles, thickness and number of segments in both directions:

Code: Select all

module sp_tria2(r, tang, pang, thi, ord, ord2) {
    ang= [ for (i = [0:ord]) i*(tang/ord) ];
    rang=[ for (i = [ord:-1:0]) i*(tang/ord) ];
    coords=concat(
        [ for (th=ang)  [(r-thi/2)*sin(th), (r-thi/2)*cos(th)]],
        [ for (th=rang) [(r+thi/2)*sin(th), (r+thi/2)*cos(th)] ]
    );
    rotate_extrude(angle=pang, $fn=ord2) polygon(coords);
}

The trick is to use "sp_tria2()" two times along the longest triangle edge.
Both do overlap a bit, but fill complete triangle area.
Last image from animation zoom shows that it really is a (round) sphere triangle:
(execute "./rjs node.tetra.js graphs/C60.a white" and open "x.scad" in OpenSCAD)
Image


Next step is to implement corner cases, and to implement "openscad_fill_face()" to draw #vertices(face)-2 spherical triangles.


P.S:
I commited and pushed snapshot as is, much cleanup needed, but works as the animation shows:
https://github.com/Hermann-SW/planar_gr ... 225f82a5d8

OpenSCAD module "sp_tria2()" shown above is here:
https://github.com/Hermann-SW/planar_gr ... #L104-L112

OpenSCAD module "sp_tria()" with all the angle calculations and rotations (see below) is here:
https://github.com/Hermann-SW/planar_gr ... #L113-L149

Code: Select all

    wlog("    color([0.5,0.5,0.5]) translate([0,0,0])");
    wlog("        rotate([0,0,la1-180])");
    wlog("        rotate([0,ph1-90,0])");
    wlog("        rotate([0,0,-al13])");
    wlog("        sp_tria2(sc, s12, al13-al12, 0.1, 40, 40);");

    wlog("    color([0.5,0.5,0.5]) translate([0,0,0])");
    wlog("        rotate([0,0,la3-180])");
    wlog("        rotate([0,ph3-90,0])");
    wlog("        rotate([0,0,-al31])");
    wlog("        sp_tria2(sc, s23, al31-al32, 0.1, 40, 40);");
 

P.S:
Made quite some progress, fill sphere triangle and polygon, determine pentagons, ... not perfect yet, but looks good:
sphere_pentagons.not_perfect_yet.png
sphere_pentagons.not_perfect_yet.png (73.33 KiB) Viewed 9002 times

P.P.S:
Nearly done, visual OpenSCAD debugging is cool:
sphere_pentagons.visual_debugging.png
sphere_pentagons.visual_debugging.png (72.98 KiB) Viewed 8998 times
https://github.com/Hermann-SW/RSA_numbers_factored
https://stamm-wilbrandt.de/GS [304+402+536fps]
https://hermann-sw.github.io/planar_graph_playground
https://github.com/Hermann-SW/Raspberry_v1_camera_global_external_shutter
https://stamm-wilbrandt.de

User avatar
HermannSW
Posts: 6575
Joined: Fri Jul 22, 2016 9:09 pm
Location: Eberbach, Germany

Re: JavaScript graph library, for embedding and drawing planar graphs in 2D and/or sphere surface

Tue Jul 26, 2022 8:37 pm

With latest commit+push I fixed most of the circles by forcing angle differences into -180..180° range with this OpenSCAD function:
https://github.com/Hermann-SW/planar_gr ... ra.js#L151

Code: Select all

    wlog("    function m180(ang) =  (ang < -180) ? 360 + ang : ((ang > 180) ? ang - 360 :ang);");

But some round overshoots remained, and reason was that "tria2()" did not create spherical triangle, but because of (needed) rotate_extrude one side is round. I determined centroid of three vertices and normalized it onto unit sphere. Then I placed a small 0.1 radius blue sphere there (for debugging only). Because the grey spherical construct is 0.1mm thick, a little blue can be seen on top (left):
hexa_hull.for_intersection.png
hexa_hull.for_intersection.png (29.84 KiB) Viewed 8963 times
I did dot products of the 3 triangle vertices with their centroid on unit sphere, and determined minimal value mi:
https://github.com/Hermann-SW/planar_gr ... #L158-L167

Code: Select all

    wlog("        ms = v1+v2+v3;");
    wlog("        ms2 = scale_3D(ms, 1/sqrt(ms*ms));");
    wlog("        mi = min(v1*ms2, v2*ms2, v3*ms2)-0.1;");

    wlog("        sv1 = scale_3D(v1, sc);");
    wlog("        sv2 = scale_3D(v2, sc);");
    wlog("        sv3 = scale_3D(v3, sc);");
    wlog("        s1 = scale_3D(sv1, 1/mi);");
    wlog("        s2 = scale_3D(sv2, 1/mi);");
    wlog("        s3 = scale_3D(sv3, 1/mi);");

Then I scaled the 3 vertices with reciprocal of mi, lifting all vertices on plane with blue dot.
As can be seen the convex hull of these 6 points completely contains all of the good spherical part for triangle.
So union of both "tria2"s
https://github.com/Hermann-SW/planar_gr ... #L170-L182

Code: Select all

    wlog("            union() {");
    wlog("                color([0.5,0.5,0.5]) translate([0,0,0])");
    wlog("                    rotate([0,0,la1-180])");
    wlog("                    rotate([0,ph1-90,0])");
    wlog("                    rotate([0,0,-al13])");
    wlog("                    sp_tria2(sc, s12, m180(al13-al12), 0.1, 40, 40);");
    wlog("                color([0.5,0.5,0.5]) translate([0,0,0])");
    wlog("                    rotate([0,0,la3-180])");
    wlog("                    rotate([0,ph3-90,0])");
    wlog("                    rotate([0,0,-al31])");
    wlog("                    sp_tria2(sc, s23, m180(al31-al32), 0.1, 40, 40);");
    wlog("            }");
intersected with convex hull of 6 vertices
https://github.com/Hermann-SW/planar_gr ... #L169-L192

Code: Select all

    wlog("        intersection() {");
...
    wlog("            hull() {");
    wlog("                translate(sv1) cube(0.01);");
    wlog("                translate(sv2) cube(0.01);");
    wlog("                translate(sv3) cube(0.01);");
    wlog("                translate(s1) cube(0.01);");
    wlog("                translate(s2) cube(0.01);");
    wlog("                translate(s3) cube(0.01);");
    wlog("            }");
    wlog("        }");
keeps correct spherical triangle for the three vertices and nothing else!

I changed white sphere to be 0.1 thick difference of spheres with radius sc and sc-0.1, and moved that code to end:
https://github.com/Hermann-SW/planar_gr ... #L227-L232

Code: Select all

    if (white) {
        wlog("difference() {");
        wlog("    color([1,1,1, 0.5]) translate([0,0,0]) sphere(sc);");
        wlog("    translate([0,0,0]) sphere(sc-0.1);");
        wlog("}");
    }
This allows to see bottom of grey spherical polygons on "other side" of sphere as well:
sphere.pentagons.1.png
sphere.pentagons.1.png (68.81 KiB) Viewed 8963 times

Here is different view after rotation of same graph:
sphere.pentagons.2.png
sphere.pentagons.2.png (67.93 KiB) Viewed 8963 times

Now that vertex labels and spherial polygons for the grey faces (colored faces for 6-coloring of planar graph later) work, it is time to combine the two parts of shortest paths tetrahedron to compute and embed all vertices of the graph on the sphere together ...
https://github.com/Hermann-SW/RSA_numbers_factored
https://stamm-wilbrandt.de/GS [304+402+536fps]
https://hermann-sw.github.io/planar_graph_playground
https://github.com/Hermann-SW/Raspberry_v1_camera_global_external_shutter
https://stamm-wilbrandt.de

User avatar
HermannSW
Posts: 6575
Joined: Fri Jul 22, 2016 9:09 pm
Location: Eberbach, Germany

Re: JavaScript graph library, for embedding and drawing planar graphs in 2D and/or sphere surface

Wed Jul 27, 2022 11:20 am

I realized that function "scale_3D()" that got moved from JavaScript/NodeJS to OpenSCAD is superfluous due to builtin Vector-Number Operators, removed it and did necessary modifications, eg:
https://github.com/Hermann-SW/planar_gr ... 64edf921b2

Code: Select all

...
    wlog("        ms = v1+v2+v3;");
-    wlog("        ms2 = scale_3D(ms, 1/sqrt(ms*ms));");
+    wlog("        ms2 = ms / sqrt(ms*ms);");
    wlog("        mi = min(v1*ms2, v2*ms2, v3*ms2)-0.1;");
...

Non-transparent "white" is needed, this change implements that and passing alpha values for transparency ("white.40" sets alpha to 40%):
https://github.com/Hermann-SW/planar_gr ... f4c97b36e0

In case you cannot leave away "white" for no transparency because additional edge selection parameter needs to be passed, "white.0" has same effect:

Code: Select all

./rjs node.tetra.js graphs/C60.a white.0
white.0_option.png
white.0_option.png
white.0_option.png (48.47 KiB) Viewed 8905 times

Code: Select all

./rjs node.tetra.js graphs/C60.a white
white_option.png
white_option.png
white_option.png (43.58 KiB) Viewed 8905 times

P.S:
With latest commit+push I added "$fn=180" to white "sphere()", now white sphere is not that coarse anymore:

Code: Select all

./rjs node.tetra.js graphs/C60.a white.70
white.70_option.png
white.70_option.png
white.70_option.png (103.13 KiB) Viewed 8858 times
https://github.com/Hermann-SW/RSA_numbers_factored
https://stamm-wilbrandt.de/GS [304+402+536fps]
https://hermann-sw.github.io/planar_graph_playground
https://github.com/Hermann-SW/Raspberry_v1_camera_global_external_shutter
https://stamm-wilbrandt.de

User avatar
HermannSW
Posts: 6575
Joined: Fri Jul 22, 2016 9:09 pm
Location: Eberbach, Germany

Re: JavaScript graph library, for embedding and drawing planar graphs in 2D and/or sphere surface

Thu Jul 28, 2022 9:43 pm

I have separated out the OpenSCAD stuff from node.tetra.js into new:
https://github.com/Hermann-SW/planar_gr ... in/scad.js

Just an "#include" for "scad.js" which defines "scad" object
https://github.com/Hermann-SW/planar_gr ... etra.js#L9

and then the whole OpenSCAD output is done in 42 lines in "node.tetra.js":
https://github.com/Hermann-SW/planar_gr ... js#L21-L62
  1. open output file

    Code: Select all

    scad.open('x.scad');
  2. pass coordinates and scaling factor into OpenSCAD, output many OpenSCAD modules

    Code: Select all

    scad.header(coords, sc);
  3. output "edge2()", "sp_tria2()" and "sp_tria()" modules

    Code: Select all

    scad.header2();
  4. output all visited edges
  5. output all vertices, with only 4 tetrahedron vertices colored red
  6. iterate over all pentagons, and if all 5 vertices were visited, output grey spherical polygon
  7. handling of white sphere
Next step is computation of coordinates for all vertices.
Separate determination for both "halves" does work already:
sphere_pentagons.split.png
sphere_pentagons.split.png (158.74 KiB) Viewed 8666 times
https://github.com/Hermann-SW/RSA_numbers_factored
https://stamm-wilbrandt.de/GS [304+402+536fps]
https://hermann-sw.github.io/planar_graph_playground
https://github.com/Hermann-SW/Raspberry_v1_camera_global_external_shutter
https://stamm-wilbrandt.de

User avatar
HermannSW
Posts: 6575
Joined: Fri Jul 22, 2016 9:09 pm
Location: Eberbach, Germany

Re: JavaScript graph library, for embedding and drawing planar graphs in 2D and/or sphere surface

Sat Jul 30, 2022 10:32 pm

I played a lot and did not get combined sphere coordinate placement correct until now.
So I went back and added parameter handling, with new options -5..-2 for selected edge:
https://github.com/Hermann-SW/planar_gr ... 99224b2797

Code: Select all

$ ./rjs node.tetra.js graphs/C60.a white.50 -5

Code: Select all

-5: left+up, w/ pentagon vertex lables
-4: right+bottom, w/ pentagon vertex lables
-3: left+up, w/o pentagon vertex lables
-2: right+bottom, w/o pentagon vertex lables

Front and back of right+bottom without vertex labels, with non-transparent white sphere:

Code: Select all

./rjs node.tetra.js graphs/C60.a white -2
sphere_pentagons.right_bottom.front_back.png
sphere_pentagons.right_bottom.front_back.png (89.69 KiB) Viewed 8418 times
https://github.com/Hermann-SW/RSA_numbers_factored
https://stamm-wilbrandt.de/GS [304+402+536fps]
https://hermann-sw.github.io/planar_graph_playground
https://github.com/Hermann-SW/Raspberry_v1_camera_global_external_shutter
https://stamm-wilbrandt.de

User avatar
HermannSW
Posts: 6575
Joined: Fri Jul 22, 2016 9:09 pm
Location: Eberbach, Germany

Re: JavaScript graph library, for embedding and drawing planar graphs in 2D and/or sphere surface

Sun Jul 31, 2022 7:38 pm

Sidetracked again, but for good. Adding 2 mirrors to scene allows to see all of the sphere the whole time!
You can follow the isolated green vertex during whole rotation, over central sphere, in left mirror and in right mirror:
viewtopic.php?p=2025118#p2025118
Image
https://github.com/Hermann-SW/RSA_numbers_factored
https://stamm-wilbrandt.de/GS [304+402+536fps]
https://hermann-sw.github.io/planar_graph_playground
https://github.com/Hermann-SW/Raspberry_v1_camera_global_external_shutter
https://stamm-wilbrandt.de

User avatar
HermannSW
Posts: 6575
Joined: Fri Jul 22, 2016 9:09 pm
Location: Eberbach, Germany

Re: JavaScript graph library, for embedding and drawing planar graphs in 2D and/or sphere surface

Mon Aug 01, 2022 2:55 pm

"First version computing all (C20+C60 sofar) vertex positions on sphere" commit:
https://github.com/Hermann-SW/planar_gr ... c36dcfa43e

It took a while for me to learn that I missed to reset M array between computations to just the 4 tetrahedron vertices:

Code: Select all

...
coords2 = doit(false);
M = M.slice(0,4);
coords3 = doit(true);
...

And from the mirror and animation work of last days I learned that a fixed view is needed.
Instead rotating OpenSCAD $vpr, rotate the objects instead (with a "union()" around):

Code: Select all

    wlog("rotate([0,-$t*360,9]) union(){");
...
    wlog("}");

It turned out that from the 25 fullerenes in current repo ("graphs/C*.a") only C20 and C60 can be processed at the moment.
So a lot more code massage is needed to finally have a sphere spring embedder for all fullerenes (planar graphs).

Both "doit()" calls shown compute half of the vertex positions inside tetrahedron trangles. This code combines the coordinates from both computations:

Code: Select all

forall_vertices(G, function(v) {
    if (coords2[0][v] == 4 * Math.PI) {
        coords[v][0] = coords3[0][v];
        coords[v][1] = coords3[1][v];
    } else {
        coords[v][0] = coords2[0][v];
        coords[v][1] = coords2[1][v];
    }
});


This is first frame of 1fps 20 steps animation created for C20 fullerene:
frame00000.png
frame00000.png
frame00000.png (24.14 KiB) Viewed 8250 times

Yes, you can't see the other side without the mirrors added, but animation proves that really complete C20 got embedded
(480KB animation slightly too large for forum attachment):
Image


This is the command line used:

Code: Select all

./rjs node.tetra.js graphs/C20.a white.60 -3

Wait, "white.60"" specified to use 60% alpha for transparency.
Why is there no see-thru?
Because "node.tetra.js" places spherical polygons onto each pentagon, and C20 (dodecahedron) has exactly 12 pentagon faces!

Same command for C60 shows transparency, the 4 red vertices are those computed for the maximal "shortest paths" tetrahedron:
Image


Yes, that is C60 sphere embedding, but it is not regular as a football:
Image


Reason is the fixation of vertex positions on tetrahedron shortest paths:
Image


I wrote about iterative sphere spring embedder before in this thread, but the attempts were not successful:
Image


Perhaps starting with the shown computed (likely convex face, not proven yet) spring embedding will eventually reach the football state for C60 ...
https://github.com/Hermann-SW/RSA_numbers_factored
https://stamm-wilbrandt.de/GS [304+402+536fps]
https://hermann-sw.github.io/planar_graph_playground
https://github.com/Hermann-SW/Raspberry_v1_camera_global_external_shutter
https://stamm-wilbrandt.de

User avatar
HermannSW
Posts: 6575
Joined: Fri Jul 22, 2016 9:09 pm
Location: Eberbach, Germany

Re: JavaScript graph library, for embedding and drawing planar graphs in 2D and/or sphere surface

Mon Aug 01, 2022 10:48 pm

node.tetra.js "side" option had no use anymore, and STL exports had problems with the too thin spherical pentagons:
https://forum.prusa3d.com/forum/prusasl ... ost-615711

So I added "dopent" option, allowing to create x.scad without spherical pentagons:
https://github.com/Hermann-SW/planar_gr ... c87acab8fc

Code: Select all

./rjs node.tetra.js graphs/C60.a white.60 -2
Image


For 3Dprinting the last line with the white sphere needs to be deleted before exporting STL — otherwise sphere inside will be printed and 3Dprint time is more than 1 day on my Prusa MINI+ 3D printer:
https://forum.prusa3d.com/forum/prusasl ... ost-615700
C60.sphere.STL.PrusaSlicer.png
C60.sphere.STL.PrusaSlicer.png (240.54 KiB) Viewed 8139 times
https://github.com/Hermann-SW/RSA_numbers_factored
https://stamm-wilbrandt.de/GS [304+402+536fps]
https://hermann-sw.github.io/planar_graph_playground
https://github.com/Hermann-SW/Raspberry_v1_camera_global_external_shutter
https://stamm-wilbrandt.de

User avatar
HermannSW
Posts: 6575
Joined: Fri Jul 22, 2016 9:09 pm
Location: Eberbach, Germany

Re: JavaScript graph library, for embedding and drawing planar graphs in 2D and/or sphere surface

Tue Aug 02, 2022 3:09 pm

I used shortest paths tetrahedron sofar in order to process the vertices in each triangle (left):
tetrahedron2circle.png
tetrahedron2circle.png (109.73 KiB) Viewed 8022 times
But I processed left+top together, as well as bottom+right.
So today I removed two of the six tetrahedron shortest paths from fixated on sphere vertices.
Because I did solve system of linear equations for each doit() call, the separating circle now reflects that.

This is part of latest commit+push:
https://github.com/Hermann-SW/planar_gr ... e51b5a1d17

Code: Select all

...
 coords2 = doit(false);
+var evisited_ = evisited;
 M = M.slice(0,4);
 coords3 = doit(true);
 
+forall_edges(G, function(e) {
+    evisited[e] = (evisited[e] && evisited_[e]);
+});
+
...
Basically evisited[e] is true by this, if and only if it is an edge of the separating circle.
With latest commit those edges are drawn orange, all other edges are drawn blue.
Here you can see that the vertices between two pairs of the red tetrahedon vertices are not on a great circle anymore:
(the orange edges are)
tetrahedron.removed_shortest_paths.png
tetrahedron.removed_shortest_paths.png (149.23 KiB) Viewed 8022 times

In this animation you can follow the separating circle orange edges completely:
Image


The 4 tetrahedron vertices were determined really inefficiently in O(|V|⁴) runtime:
https://github.com/Hermann-SW/planar_gr ... s#L91-L113

I can replace that by an efficient algorithm that finds a circle in planar graph that has roughly the same number of vertices inside and outside (for even distribution of sphere spring embedding). That circle can be long or short (that would fixate only few vertices). All separating circle vertices will be fixated on sphere as shown in top screenshot right side, then the remaining vertex positions will be computed by two "doit()" calls.


P.S:
Just searched Wikipedia and found planar separator theorem, especially "simple cycle separators":
https://en.wikipedia.org/wiki/Planar_se ... separators
For a graph that is already maximal planar it is possible to show a stronger construction of a simple cycle separator, a cycle of small length such that the inside and the outside of the cycle (in the unique planar embedding of the graph) each have at most 2n/3 vertices. ... Djidjev & Venkatesan (1997) further improved the constant factor in the simple cycle separator theorem to 1.97 √n vertices.
Seems to be what I want ... a non-maximal planar embedding can be triangulated easily.


P.P.S:
The great circle arc length between the 4 red vertices is 108°.
Because there are 5 green vertices between the two horizontal red vertices, spherical arc (edge2) between two neighboring is 18°.
The animation was created with 20 steps, so a step has 360°/20=18° as well.
That is the reason why the vertices between the two horizontal red vertices are mapped on another with each animation step.
https://github.com/Hermann-SW/RSA_numbers_factored
https://stamm-wilbrandt.de/GS [304+402+536fps]
https://hermann-sw.github.io/planar_graph_playground
https://github.com/Hermann-SW/Raspberry_v1_camera_global_external_shutter
https://stamm-wilbrandt.de

User avatar
HermannSW
Posts: 6575
Joined: Fri Jul 22, 2016 9:09 pm
Location: Eberbach, Germany

Re: JavaScript graph library, for embedding and drawing planar graphs in 2D and/or sphere surface

Wed Aug 03, 2022 4:47 pm

Instead of using pentagon spherical polygons of C20, making white sphere thin might allow to 3Dprint all planar graphs sphere spring embedded.
I generated OpenSCAD "look_inside" variable defaulting to false. When changing that to true in OpenSCAD, a cube will be subtracted and a look into inside is possible.

The look inside revealed that there are vertex sphere parts inside not needed for 3Dprinting, since they cannot be seen.
Newly generated "diff_last" variable is false and subtracts sphere of redius "sc-0.1" from sphere of radius "sc".
That is fast, but has the inner stuff.

Setting "diff_last" to true leads to huge initial runtime and every rotation gets very slow.
But the effect is as wanted, see right.
So operation will be to generate x.scad, inspect quickly in OpenSCAD, and if all is fine to set "diff_last" to true and then press F6 to render for following export as STL and 3Dprinting.

This is the small diff that added the new features:
https://github.com/Hermann-SW/planar_gr ... 8bbd107c10

Edges have radius 0.1, while white sphere is 0.1 thick. Therefore edges look out 0.1 on outside. On inside tip of blue edges can be seen left:
white_sphere.differences.png
white_sphere.differences.png (103.73 KiB) Viewed 7937 times

I could not resist to create an animation with look_inside set to true:
Image
https://github.com/Hermann-SW/RSA_numbers_factored
https://stamm-wilbrandt.de/GS [304+402+536fps]
https://hermann-sw.github.io/planar_graph_playground
https://github.com/Hermann-SW/Raspberry_v1_camera_global_external_shutter
https://stamm-wilbrandt.de

User avatar
HermannSW
Posts: 6575
Joined: Fri Jul 22, 2016 9:09 pm
Location: Eberbach, Germany

Re: JavaScript graph library, for embedding and drawing planar graphs in 2D and/or sphere surface

Thu Aug 04, 2022 8:57 am

I asked on reddit.com/r/openscad wrt "dfference()" efficiency and got explanation and possible direction.
I followed different approach in subtracting small "cube()"s from inner side of vertex spheres, details in this forum posting:
https://forum.prusa3d.com/forum/prusasl ... ost-615972
Left is not good first approach, right is working and much more efficient approach:
Image


I did run new option (-6) once with "white.0", which is fully transparent and does not show white sphere.
I have no use case for this parameter combination yet, but at least this allows to see complete separating circle (orange edges) at once, and still have an idea of what is front and what is back (black):
white_sphere.vertex_minus_cube.2.png
white_sphere.vertex_minus_cube.2.png (24.02 KiB) Viewed 7878 times
https://github.com/Hermann-SW/RSA_numbers_factored
https://stamm-wilbrandt.de/GS [304+402+536fps]
https://hermann-sw.github.io/planar_graph_playground
https://github.com/Hermann-SW/Raspberry_v1_camera_global_external_shutter
https://stamm-wilbrandt.de

User avatar
HermannSW
Posts: 6575
Joined: Fri Jul 22, 2016 9:09 pm
Location: Eberbach, Germany

Re: JavaScript graph library, for embedding and drawing planar graphs in 2D and/or sphere surface

Thu Aug 04, 2022 6:37 pm

The 4 tetrahedron vertices were determined really inefficiently in O(|V|⁴) runtime, and should guarantee that everything gets spread over the sphere somewhat evenly.

Today I chose 4 vertices from a pentagon face of C20 fullerene and overwrote the determined set of 4 vertices. This forces all other vertices to be on one side of separating circle, (orange edges) the other side is empty. Mode -8 does that with latest commit:
https://github.com/Hermann-SW/planar_gr ... tra.js#L22
https://github.com/Hermann-SW/planar_gr ... ra.js#L127

Code: Select all

./rjs node.tetra.js graphs/C20.a white.60 -8
C20.face_as_separating_circle.png
C20.face_as_separating_circle.png (72.32 KiB) Viewed 7814 times

Then I looked at two neighboring pentagons and chose every 2nd vertex of both when removing the separating edge.
The separating edge 21 between vertex 10 (top left) and vertex 14 (bottom right) gets drawn through the other edges.
Therefore for option -9 edge 21 will not get drawn:
https://github.com/Hermann-SW/planar_gr ... tra.js#L17
https://github.com/Hermann-SW/planar_gr ... js#L42-L45
C20.two_face_separating_circle-e.png
C20.two_face_separating_circle-e.png (73.46 KiB) Viewed 7814 times


Vertex 10 is north pole, and vertex 14 is south pole in that embedding, and I will need to fix that corner case later.

Overall spring embedding works, for terahedron circle, an empty circle (face) or any other separating circle.
https://github.com/Hermann-SW/RSA_numbers_factored
https://stamm-wilbrandt.de/GS [304+402+536fps]
https://hermann-sw.github.io/planar_graph_playground
https://github.com/Hermann-SW/Raspberry_v1_camera_global_external_shutter
https://stamm-wilbrandt.de

Return to “Other programming languages”